Unlock Over 2,000 Lessons
Subscribe today and join the thousands of worldclass organizations already learning with Gemba Academy.
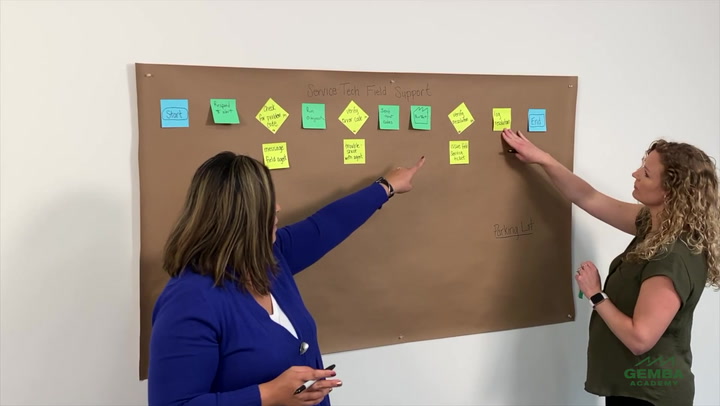
How to Make Process Maps with Sticky Notes
Process mapping makes the workflow visible so that we can study and improve it. A quick and simple method to start creating flowcharts is to use sticky notes. Learn the benefits of this approach, how to get started, and the steps of this method.
Course Videos
Getting Started With Business Process Mapping
09:33
2What Is A SIPOC Diagram
05:27
3How to Create a SIPOC Diagram
05:26
4How to Create a Turtle Diagram
05:39
5What Is A Business Model Canvas?
06:41
6How to Create a Business Model Canvas
07:41
7What Is an Empathy Map?
02:30
8How to Create Empathy Maps
08:06
9What Is a Flowchart?
05:03
10How to Create a Flowchart
05:43
Current Video
How to Make Process Maps with Sticky Notes
09:03
Next VideoHow to Create Process Charts
05:50
13What Is Swim Lane Mapping?
03:39
14How to Create a Swim Lane Map
11:15
15What Is a Makigami Analysis?
05:02
16How to Do a Makigami Analysis
09:45
17What Is Transactional Value Stream Mapping?
09:24
18Current State Value Stream Mapping of Treetop Purchasing
09:05
19Future State Value Stream Mapping of Treetop Purchasing
06:20
20Creating a Current State Transactional Value Stream Map
10:09
21Creating a Future State Transactional Value Stream Map
08:45
You must be logged in to access Gemba Academy resources.
Video Resources
Quiz
Course Resources
Quiz
Next Video How to Create Process Charts
The Process Chart is a simple way to make a compact yet detailed diagram to analyze a process. Learn the situations when this approach is most useful, the meaning of the common symbols, and the steps to filling out the Process Chart template.