Unlock Over 2,000 Lessons
Subscribe today and join the thousands of worldclass organizations already learning with Gemba Academy.
How to Create a SIPOC Diagram
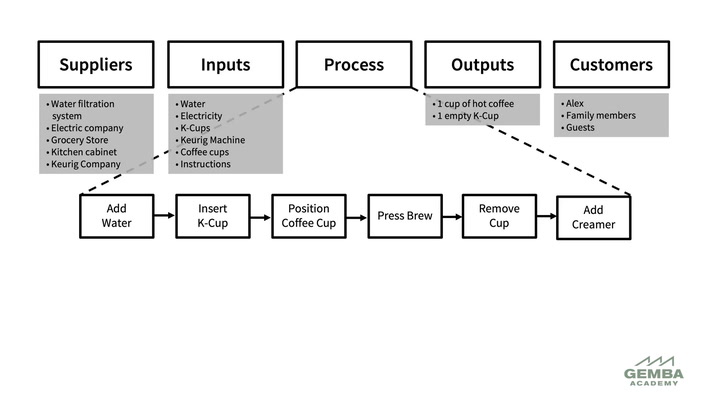
The SIPOC diagram is a process mapping tool that summarizes the inputs and outputs of a series of processes. Learn how to create and use SIPOC diagrams step by step.
Course Videos
Getting Started With Business Process Mapping
09:33
2What Is A SIPOC Diagram
05:27
Current Video
How to Create a SIPOC Diagram
05:26
Next VideoHow to Create a Turtle Diagram
05:39
5What Is A Business Model Canvas?
06:41
6How to Create a Business Model Canvas
07:41
7What Is an Empathy Map?
02:30
8How to Create Empathy Maps
08:06
9What Is a Flowchart?
05:03
10How to Create a Flowchart
05:43
11How to Make Process Maps with Sticky Notes
09:03
12How to Create Process Charts
05:50
13What Is Swim Lane Mapping?
03:39
14How to Create a Swim Lane Map
11:15
15What Is a Makigami Analysis?
05:02
16How to Do a Makigami Analysis
09:45
17What Is Transactional Value Stream Mapping?
09:24
18Current State Value Stream Mapping of Treetop Purchasing
09:05
19Future State Value Stream Mapping of Treetop Purchasing
06:20
20Creating a Current State Transactional Value Stream Map
10:09
21Creating a Future State Transactional Value Stream Map
08:45
You must be logged in to access Gemba Academy resources.
Video Resources
Quiz
Downloads
Course Resources
Quiz
Next Video How to Create a Turtle Diagram
The Turtle Diagram is a simple way to create a high-level diagram to identify the key requirements for a single process. Learn how to use Turtle Diagrams to identify the inputs, outputs, and resources needed to perform a process.