Unlock Over 2,000 Lessons
Subscribe today and join the thousands of worldclass organizations already learning with Gemba Academy.
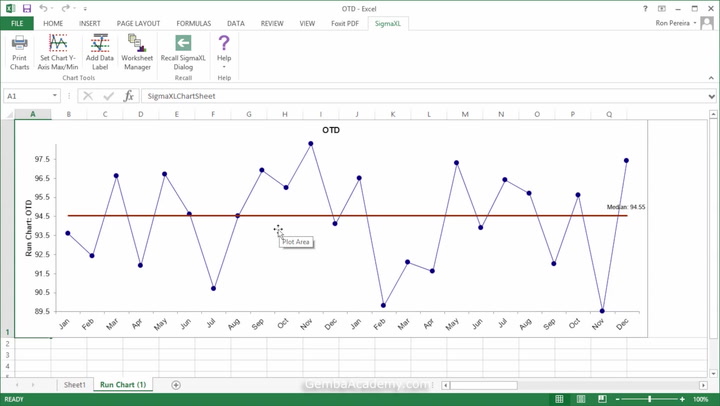
Creating Run Charts with SigmaXL
Learn how to create Run Charts in SigmaXL.
Course Videos
PPS Overview
07:52
2PDCA
04:29
3Treetop, Inc.
01:36
4Step 1: Clarify the Problem
07:37
5How to Write a Problem Statement
06:17
6Introduction to SigmaXL
05:26
7Creating Pareto Charts with SigmaXL
02:38
Current Video
Creating Run Charts with SigmaXL
04:06
Next VideoCreating Control Charts with SigmaXL
04:16
10Step 2: Break Down the Problem
11:57
11Creating Dot Plots with SigmaXL
01:50
12Step 3: Set a Target
06:26
13Step 4: Analyze Root Causes
04:40
14Fishbone Diagram Explained
06:09
15Five Why Explained
06:12
16Treetop Gets to the Root Causes
04:33
17Creating Scatter Plots with SigmaXL
04:17
18Step 5: Develop Countermeasures
04:59
19Step 6: See Countermeasures Through
03:32
20Step 7: Evaluate the Process and Results
03:14
21Step 8: Standardize Success and Learn from Failures
05:18
22PPS Action Guide
02:38
You must be logged in to access Gemba Academy resources.
Video Resources
Quiz
Downloads
Course Resources
Quiz
Next Video Creating Control Charts with SigmaXL
Learn how to create Control Charts in SigmaXL.