Unlock Over 2,000 Lessons
Subscribe today and join the thousands of worldclass organizations already learning with Gemba Academy.
How to Use a Yamazumi Chart
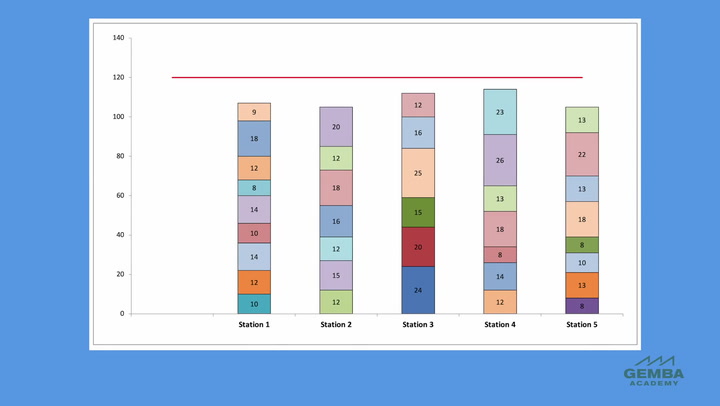
The yamazumi chart is a visual tool to break down, analyze, and rebalance workloads between team members of a cell or other operations connected in a flow. Learn the details of the five steps for creating and using a yamazumi chart.
Course Videos
Managing Cellular Workflow
04:55
2Getting Started with Cell Design
06:36
3How to Perform a P-Q Analysis for Cell Design
05:06
4How to Create a Parts-Process Matrix for Cell Design
07:27
5How Many Cells Do We Need?
07:45
6How to Use a Process Capacity Table for Cell Design
07:16
7When to Build Multiple Slower Cells
07:35
8How to Arrange Equipment in a Cell
07:21
9How to Select Equipment for a Cell
04:41
10What Is Right-Sized Equipment?
05:07
11How to Build Flexibility Into Cells
08:11
12How to Set Equipment Spacing in a Cell
07:26
13How to Design Cellular Workflow Around People
08:26
14What Is a Yamazumi Chart?
04:05
Current Video
How to Use a Yamazumi Chart
05:36
Next VideoHow to Calculate Crew Size for Standard Work
04:05
17How to Move Materials In and Out of Cells
05:03
18How to Practice Visual Management in a Cell
06:33
19How Cells Change Cost Reporting
09:33
You must be logged in to access Gemba Academy resources.