Subscription Required
To get access to this video, and more than 1000 like it Subscribe Online today!
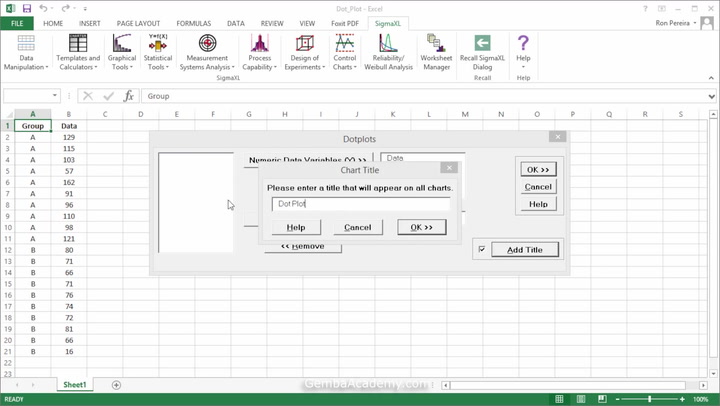
Creating Dot Plots with SigmaXL
Learn how to quickly create Dot Plots using SigmaXL.
Course Videos
PPS Overview
10:47
2PDCA
6:25
3Treetop, Inc.
2:34
4Step 1: Clarify the Problem
9:49
5How to Write a Problem Statement
06:17
6Introduction to SigmaXL
5:26
7Creating Pareto Charts with SigmaXL
2:38
8Creating Run Charts with SigmaXL
4:06
9Creating Control Charts with SigmaXL
4:16
10Step 2: Break Down the Problem
16:37
Current Video
Creating Dot Plots with SigmaXL
1:50
Next VideoStep 3: Set a Target
7:34
13Step 4: Analyze Root Causes
5:26
14Fishbone Diagram Explained
10:25
15Five Why Explained
7:58
16Treetop Gets to the Root Causes
6:56
17Creating Scatter Plots with Sigma XL
4:16
18Step 5: Develop Countermeasures
9:12
19Step 6: See Countermeasures Through
6:06
20Step 7: Evaluate the Process and Results
6:42
21Step 8: Standardize Success and Learn from Failures
8:41
22PPS Action Guide
3:40