Unlock Over 2,000 Lessons
Subscribe today and join the thousands of worldclass organizations already learning with Gemba Academy.
How to Use Throughput Histograms in Agile Kanban
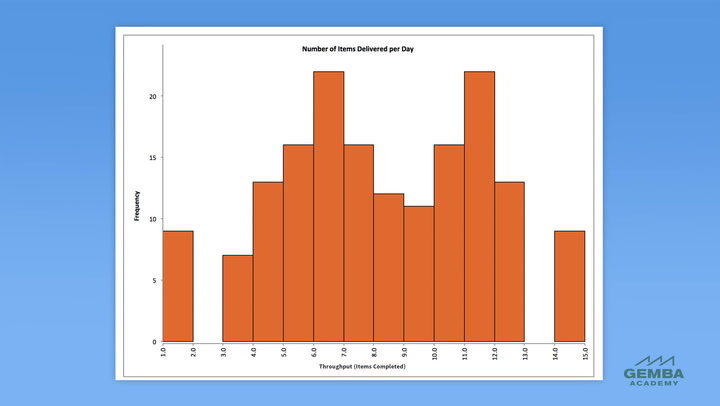
Throughput histograms help us visualize information such as the median value, the width of spread, and the overall distribution of a team’s output. Learn how to draw this chart and what its different shapes tell us about our workflow.
Course Videos
Introduction To Tracking Agile Kanban Performance
01:01
2How to Use Cycle Time Scatter Plots in Agile Kanban
03:32
3How to Use Lead Time Scatter Plots in Agile Kanban
03:45
4How to Use Cumulative Flow Diagrams to Track WIP in Agile Kanban
03:46
5What Is Little’s Law in Agile Kanban?
05:30
6How to Use Throughput Run Charts in Agile Kanban
02:54
7How to Use Block Resolution Time Charts in Agile Kanban
02:32
8How to Use Cumulative Flow Diagrams to Track Blockers in Agile Kanban
03:53
9How to Use Cycle Time Histograms in Agile Kanban
02:21
10How to Use Lead Time Histograms in Agile Kanban
02:34
11How to Use Aging Charts to Track WIP in Agile Kanban
03:11
Current Video
How to Use Throughput Histograms in Agile Kanban
05:35
Next VideoHow to Calculate Flow Efficiency in Agile Kanban
03:44
14What Is a Monte Carlo Simulation?
03:51
15Collecting Data For Agile Kanban Performance Metrics
03:26
You must be logged in to access Gemba Academy resources.
Video Resources
Course Resources
Quiz
Next Video How to Calculate Flow Efficiency in Agile Kanban
Flow efficiency is a kanban metric that compares the touch time within a workflow to the total elapsed time for that same workflow. Learn how to calculate flow efficiency and use this number to identify opportunities to improve responsiveness and organizational agility.