Unlock Over 2,000 Lessons
Subscribe today and join the thousands of worldclass organizations already learning with Gemba Academy.
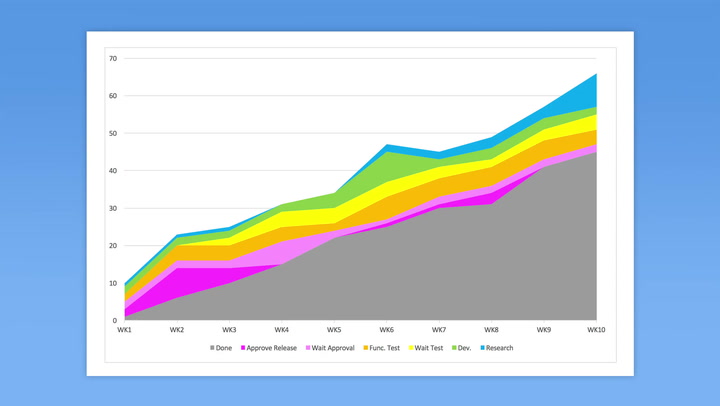
How to Use Cumulative Flow Diagrams to Track WIP in Agile Kanban
The Cumulative Flow Diagram can be used to help teams visualize how the WIP in their system changes over time. Learn how this chart helps teams track WIP levels, reveal bottlenecks and blockers, and highlight changes in performance trends.
Course Videos
Introduction To Tracking Agile Kanban Performance
01:01
2How to Use Cycle Time Scatter Plots in Agile Kanban
03:32
3How to Use Lead Time Scatter Plots in Agile Kanban
03:45
Current Video
How to Use Cumulative Flow Diagrams to Track WIP in Agile Kanban
03:46
Next VideoWhat Is Little’s Law in Agile Kanban?
05:30
6How to Use Throughput Run Charts in Agile Kanban
02:54
7How to Use Block Resolution Time Charts in Agile Kanban
02:32
8How to Use Cumulative Flow Diagrams to Track Blockers in Agile Kanban
03:53
9How to Use Cycle Time Histograms in Agile Kanban
02:21
10How to Use Lead Time Histograms in Agile Kanban
02:34
11How to Use Aging Charts to Track WIP in Agile Kanban
03:11
12How to Use Throughput Histograms in Agile Kanban
05:35
13How to Calculate Flow Efficiency in Agile Kanban
03:44
14What Is a Monte Carlo Simulation?
03:51
15Collecting Data For Agile Kanban Performance Metrics
03:26
You must be logged in to access Gemba Academy resources.
Video Resources
Course Resources
Quiz
Next Video What Is Little’s Law in Agile Kanban?
The formula for Little’s Law connects the three key kanban metrics of throughput, work in progress, and lead time. This helps us to understand the way changes to any one of these metrics affect the other two. This is useful for analyzing our processes as well as for segmenting work into Classes of Service. Learn how the formula works, its underlying assumptions, and how to use it to manage workflow.