Unlock Over 2,000 Lessons
Subscribe today and join the thousands of worldclass organizations already learning with Gemba Academy.
How to Use a P‑M Analysis Storyboard
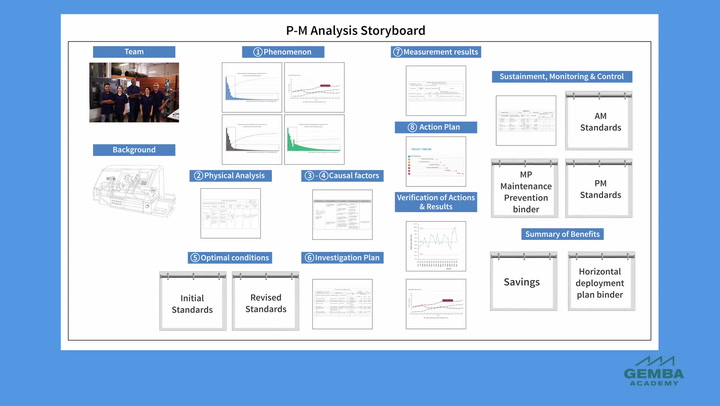
Visual display boards are effective tools for teams to organize, communicate, monitor performance, and follow-up on improvement activities. The P‑M analysis storyboard helps us show the work we do to find the causes of a problem phenomenon, eliminate the causes, and sustain the results. Learn the typical design of this storyboard, how its sections relate to the eight steps of P‑M analysis and the seven guidelines for using this tool effectively.
Course Videos
What Is P-M Analysis?
04:11
2Getting Started with P-M Analysis
05:34
3How to Reduce Chronic Losses
07:49
4P-M Analysis Step 1: Clarify the Phenomenon
07:26
5P-M Analysis Step 2: What Is a Physical Analysis?
04:36
6P-M Analysis Step 2: How to Conduct a Physical Analysis
08:15
7P-M Analysis Step 2: How to Draw a Process Diagram
04:03
8P-M Analysis Step 3: Identify Constituent Conditions
09:20
9P-M Analysis Step 4: Study the Relevance of 4M Factors
06:02
10P-M Analysis Step 5: Define Optimal Conditions
05:46
11P-M Analysis Step 6: Study Investigation and Measurement Methods
03:15
12P-M Analysis Step 7 Identify Deviations from Optimal Conditions
03:26
13P-M Analysis Step 8 Draft and implement corrective action plan
05:04
14How to Sustain the Results of P-M analysis
07:59
Current Video
How to Use a P-M Analysis Storyboard
04:41
You must be logged in to access Gemba Academy resources.